
Welcome to this week’s edition of Curranomics® from the Crystal Beach Investor Center.
TL/DR (Too Long/Didn’t Read) Summary: A mixed week for assets; stocks up, crypto’s sideways, gold and silver’s winning streak came to an end, and US Treasuries didn’t move much.
Stocks/Equities: Ended up this week-the three major US indices keep making new all time highs.
Gold/Silver: The weeks-long winning streak finally came to an end.
Cryptocurrency: Another boring week of going sideways. What on earth happened to “Uptober”?
Bonds/US Dollar: Bond yields and prices basically unchanged. Also, USD unchanged this week.
Special Topic: US Midterm Election Years
Stocks:
The main news this week was today’s Consumer Price Index (CPI) update from the US Bureau of Labor Statistics (BLS) on the inflation numbers from September:
CPI Report Today: Inflation Climbs to 3%—But Fed Is Still Expected To Cut Rate
Stocks jumped on the news that despite September’s inflation being marginally higher than in August, it was lower than economists’ expectations, therefore the Federal Reserve (Fed) is still expected to cut interest rates when its Open Markets Committee (FOMC) meets next Tuesday and Wednesday. The officially stated reason as to why the Fed is reluctant to lower interest rates during times of higher inflation, is because a lower cost of borrowing encourages consumer spending, and thus has a tendency to drive up retail prices. Conversely, raising interest rates is supposed to help lower inflation.
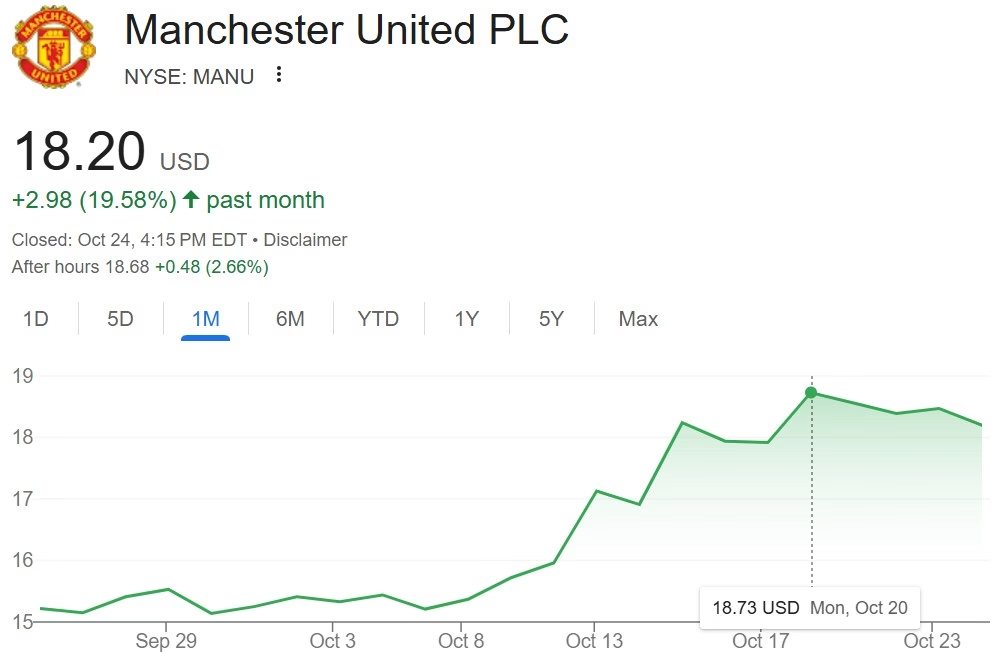
Even the share price of my football/soccer team Manchester United has been rising recently. It trades on the New York Stock Exchange, and is normally one of my worst performing investments. However, this month it’s up 20%:
manu stock price – Google Search
It’s also worth mentioning that one of the four companies carrying the entire US stock market, Meta (the others being Microsoft, Netflix, and Nvidia) announced 600 further job cuts this week-from its AI division, of all places:
In memo, Wang explains 600-worker layoff at Meta
I do wonder if “because of AI” is simply being used as a convenient blanket excuse to fire more and more people.
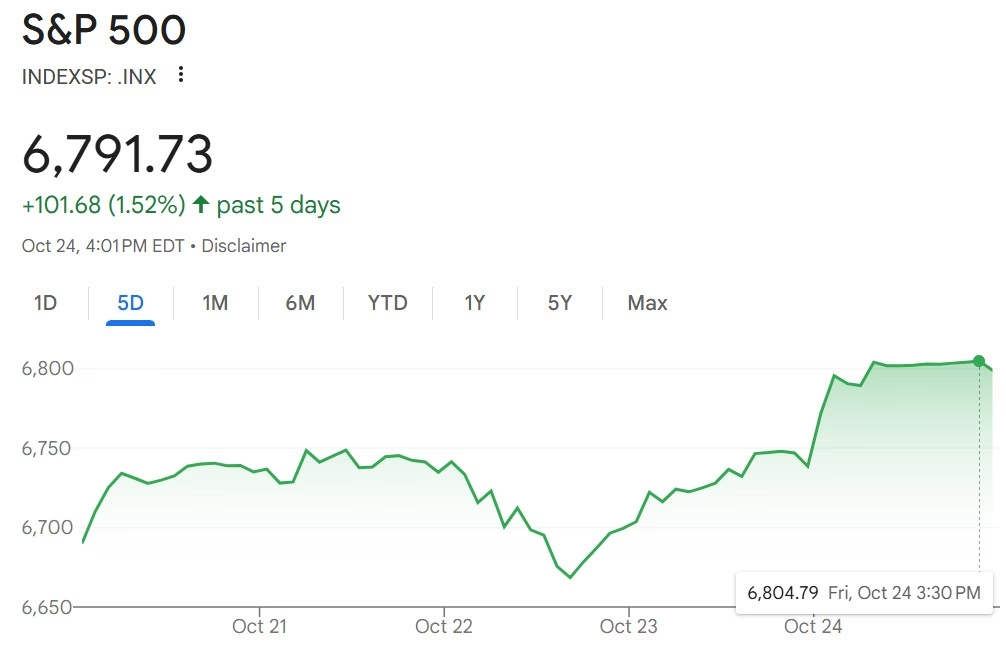
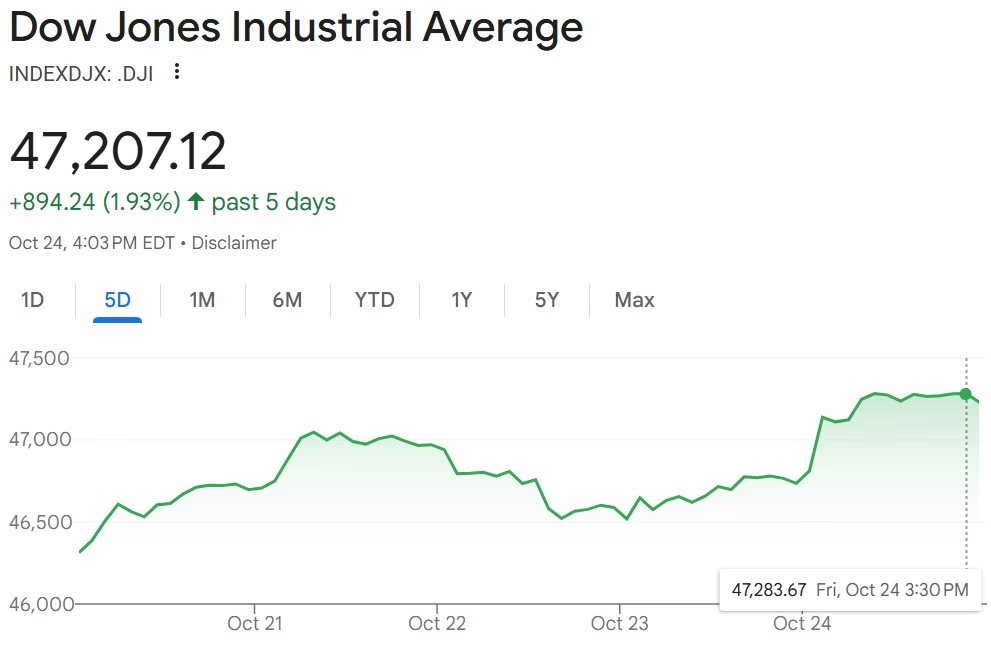
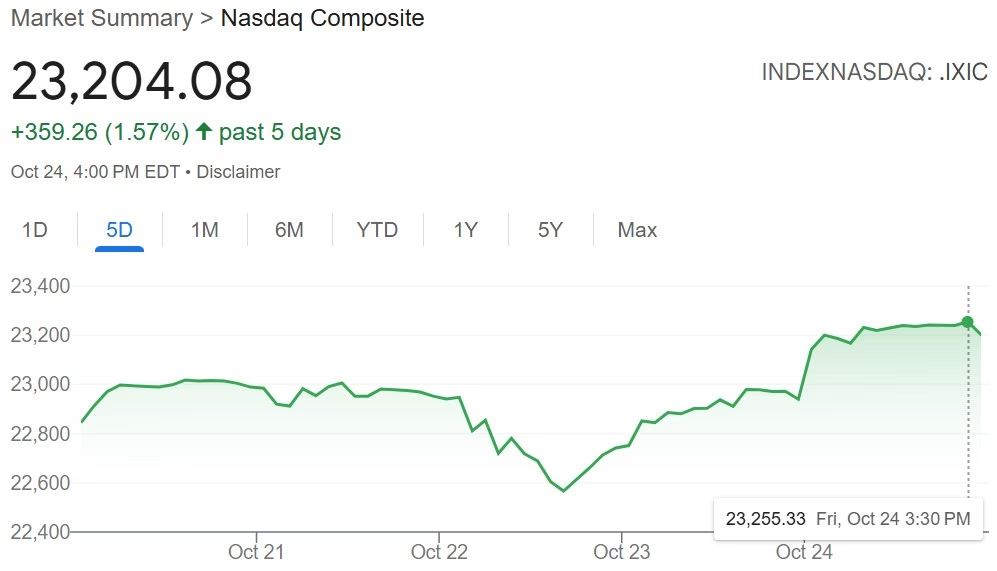
So, in summary-the three major US indices reached new all time highs again today (the S&P was briefly above 6,800 points for the first time ever-so timewise we’re probably not far from reaching 7,000)-and assuming the Fed cuts rates as expected next week and again in December, the growth is unlikely to slow any time soon (barring some unexpected mention of the forbidden word “tariff”):
nasdaq composite – Google Search
Gold/Silver:
In last week’s market update, I stated the following:
It’s been an incredible rally throughout this year for both precious metals, and at some point, they’ll fall and consolidate for a while. When this is I don’t know; but I do hope that it’s above the key levels of $4,000 (gold) and $50 (silver) when they do so.
Was that comment the kiss of death for this year’s bull market in precious metals? I can’t say for sure (ha ha), but on Tuesday October 21st, prices fell to earth following a huge selloff:
Gold, silver tumble in biggest daily drop in years as stunning precious metals rally comes to a halt
The amazing recent run up couldn’t last forever. Gold’s still up 55% this year, and silver 62%-definitely 2025’s best performing assets so far. With all the economic uncertainty around us, I expect gold and silver to continue to perform well in the medium term. I remain optimistic that we’ll see $5,000/oz gold in 2026.
Gold closed the week at $4,125, down $140 or ~3% since last Friday. It remained above the key $4,000/oz support level-great news.
Silver closed the week at $48.77, down $3.34 or ~6% since last Friday. It did not remain above the key $50/oz support level-not so great news.
Gold/Silver Ratio: Climbed significantly to 84.6 (was 81.8 last Friday).
Cryptos:
Having bought my first Cryptocurrency in 2017, I should know by now that the market has a tendency to do the exact opposite of what is expected of it-seemingly just to annoy us (and myself in particular, of course!). October of a post-halving year has historically been one of crypto’s best months, yet so far this year, it’s been a huge let down. The massive liquidation we saw two Fridays ago certainly didn’t help.
Per last week’s Crypto section, now that gold’s rally has stalled, it’s possible that that may be a signal for Bitcoin to take off instead. But who knows?
A lot of crypto investors are publicly saying they believe prices have peaked for this cycle, and that we’re already heading downwards into a 2026 crypto bear market. I maintain that this cycle isn’t done yet, but every day that goes by means we’re running shorter on time for Bitcoin to reach new all time highs-assuming the traditional crypto four-year-cycle isn’t extended. However, if Bitcoin, which always leads the crypto market, starts consistently closing below $100k, then October 6th’s price of $126k might be as good as it gets this year. The upcoming expected rate cuts from the Fed should help (as mentioned in the Stocks section, their next announcement is scheduled for next Wednesday-October 29th).
Prices on the week:
Bitcoin’s up about $4k at around $111k.
Ethereum’s up $100 at around $3,900.
BTC/ETH ratio: Up to to 28.1 (was 27.8 last Friday). This ratio has stalled in the 20s. If Ethereum’s going to have a decent final push in Q4 2025, we need BTC/ETH to rise first, as Bitcoin rises, then fall, as Ethereum catches up.
Ripple (XRP) up 7% at around $2.50.
Solana’s level at around $193.
PLEASE NOTE: Cryptos are the only assets covered in this newsletter which trade during the weekend. They’re also very volatile. And there’s usually a delay between the time I collect the data and send the newsletter. As such, the market may have moved substantially from the above numbers by the time you read this.
Bonds/US Dollar:
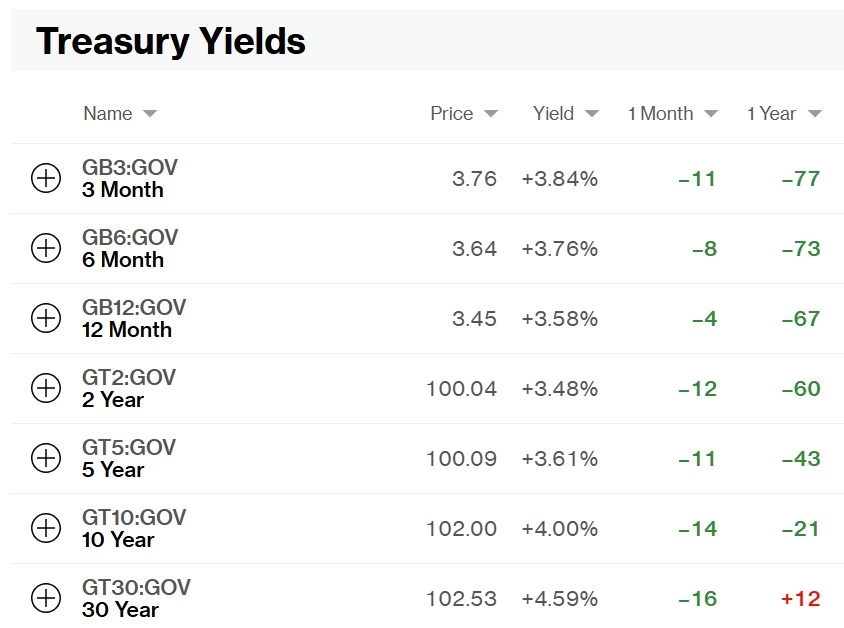
The US Treasury 10-year bond yield is now at 4.00% (was 4.01% as of last week, so very slightly lower).
The 30-year bond yield decreased by 2 basis points (was 4.61%, now 4.59%), so also lower on the month. This means the bonds’ prices have risen, since bond prices and yields are inversely correlated.
The green values in the screenshot below from Bloomberg show that with the exception of the 30-year-bond, interest rates on all US government debt have fallen in the past twelve months. With the US borrowing more, and having to refinance more debt than ever, this is no doubt being welcomed by the US Treasury department. However, remember-if more and more of our debt is refinanced at the short end of the yield curve, even though it’s less expensive, we’ll be required to “roll it over” more often-meaning we’ll have to continually find buyers for it, as opposed to only having to do so every 10-30 years.
https://www.bloomberg.com/markets/rates-bonds/government-bonds/us
Meanwhile, the US Dollar has remained the same against the Swiss Franc-as with last week, it still costs $1.26 to buy 1CHF. Seems fairly range bound at the moment; one Swiss has cost between $1.22-$1.27 since June.
Special Topic: US Midterm Election Years
In today’s special topic, I’m going to focus on American stocks-which may seem US-centric of me, but with the interconnectivity of all regions and markets nowadays, the same idea applies everywhere. Besides, America is responsible for almost half of the market capitalization of the world’s stock exchanges:
The $124 Trillion Global Stock Market, Sorted by Region
So, wherever you are in the world, if you invest in stocks, there’s a good chance you have exposure to American-based firms.
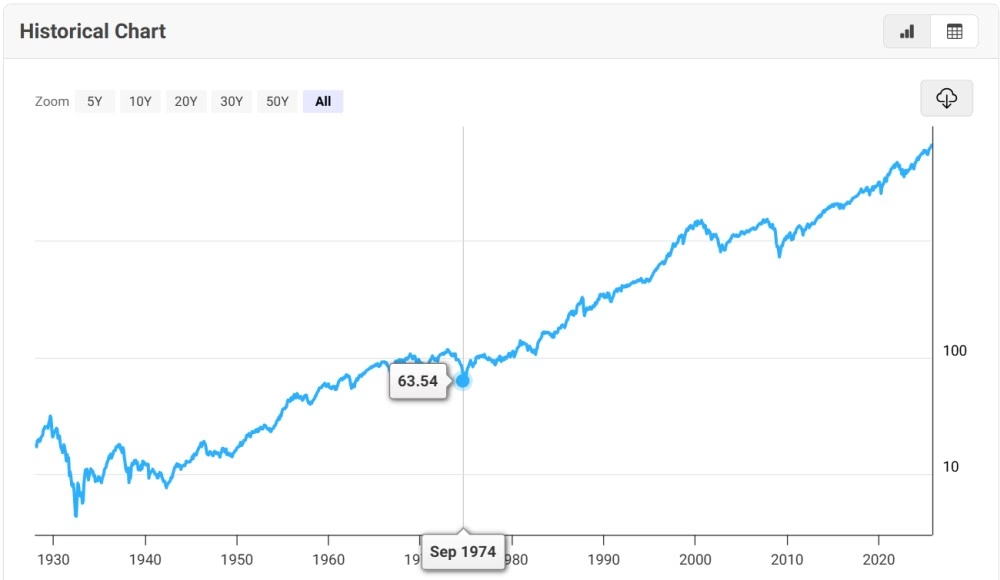
Here at Curranomics, we often talk about the “four year cycle”, especially with regards to the crypto markets (sadly, of late, it’s been in the context of “what the bloody hell happened to crypto’s four year cycle?”). However, it turns out that Bitcoin is far from the first asset to establish a four year cycle over long periods of time. Below is a chart of the S&P 500 starting in December 1927, through to this month. I’ve highlighted a local low point in September 1974 for reasons which will become clear shortly:
S&P 500 – 100 Year Historical Chart
It doesn’t happen every time-but notably in 1962, 1966, 1970, 1974, 1978, 1982, 1990, 2002, and 2022, the S&P recorded a local bottom. What do all these years have in common? They are US Presidential election midterm years; i.e., the even numbered year between two presidential elections:
https://www.congress.gov/crs_external_products/R/PDF/R46413/R46413.5.pdf
Side note-the above document was written by Caitlin Curran, Congress’s Reference and Digital Services Librarian (no relation-that I’m aware of).
The decline which occurred in 2022, i.e. the most recent midterm year, was a steep one. In December 2021, the S&P index peaked on a monthly average of 4,766, before finally bottoming in September 2022 at 3,586. That’s a 25% decline in 10 months; not pretty.
My point is that 2026 is such a midterm year. Does this mean that stocks will underperform next year? I have no idea. All I’m saying is that it’s happened before, and that we should be prepared for all eventualities; this one included. One of the reasons I started sending this newsletter was to raise awareness amongst people who own a financial portfolio, but rarely, if ever, check on its progress, until some calamity occurs, and before they know it, they’re $50k worse off than they were yesterday.
If we’re going to have a bad year, next year would make sense for a number of other reasons. The Wall Street insiders (such as Berkshire Hathaway Inc. founder Warren Buffet) need to realize profits by selling to ordinary investors at a market top, then allowing it to fall before buying back in at a lower price. As of the end of last year, Buffet was already sat on $334,000,000,000 of cash, waiting for a suitable home for it:
As discussed in previous market updates, I’m of the opinion that sitting Vice President JD Vance is already being positioned to take over from President Trump in 2028. Trump is ineligible to run for a third term by the 22nd amendment to the US Constitution:
22nd Amendment – Two-Term Limit on Presidency | Constitution Center
It would make sense for a stock market decline to occur next year and be blamed on the outgoing Trump, before recovering in 2027, for which Vance can claim credit. However, I have no idea if things will play out this way-this is only a theory (if anyone else has ideas, please let me know). One other key item to bear in mind is the replacement of Jerome Powell as chairman of the board of governors of the Federal Reserve system, next May:
Trump says that Powell will leave his office in 8 months
Whomever is nominated by the President will likely be less stubborn than Powell has been with regard to lowering the Fed funds interest rate (at least publicly-remember, I’m of the view that both Trump and Powell are servants of the banking sector). This should be bullish for risk assets such as stocks, and cryptocurrencies. So, in summary-there’s a lot to keep our eyes on over the next few months. One thing I can say with certainty, is that we are all alive at one of the most interesting times in financial history!
Alright. Until next time, I’ll talk atcha. If anyone has any comments or questions, please let me know.
Good luck and happy investing,
Tom Curran


